头部背景图片

Fabric air permeability tester

2026-05-15

The significance of fabric air permeability test


Air permeability is a physical index that characterizes the air permeability in the tested sample, mainly for porous materials with large air permeability, such as textiles, sponges, leather, etc. For fabric materials, the air permeability is related to the number and size of the gaps between the warp and weft yarns and the gaps between the fibers, the warp and weft density, the yarn twist, the fiber properties, the yarn structure, the fabric thickness and other factors.Different requirements for fabrics have different air permeability according to their specific uses. For example, the air permeability of fabrics used to make parachutes should be strictly controlled within the specified range. If the air permeability is too large, the parachute cannot be fully inflated. If the air permeability is too small, the stability of the parachute is poor or even damaged. Fabrics used as carpets are required to have relatively high air permeability. Even if they are all fabrics for making clothes, their air permeability should also vary to ensure that the clothes are comfortable to wear. For example, summer clothes should have a large air permeability and good heat dissipation, while winter coats should have a small air permeability to improve the warmth retention effect. Therefore, appropriate air permeability is one of the prerequisites for fabrics to have good performance.


Test principle of fabric air permeability test


According to the specified method and parameters, clamp the sample at the air inlet of the fabric air permeability tester, and then adjust the fan speed to achieve a pressure difference on both sides of the fabric. The air permeability of the breathable fabric is determined based on the nozzle aperture and the size of the pressure difference on both sides. The air permeability refers to: the gas flow rate per unit area of the fabric vertically per unit time under the specified p.

Next, set a specified pressure difference on the tester, which is usually adjusted according to the test standard and fabric characteristics.

Then start the tester and measure the air flow through the fabric under the set pressure difference. The test results are expressed in volume flow units, such as cm's or L/min.

Finally, the tester automatically records the measured data and calculates the air permeability index of the fabric. According to different test standards, air permeability can be expressed as air flow or air permeability.

To ensure the accuracy and comparability of test results, various countries and regions have established multiple air permeability test standards. Common standards include the ASTM D737 standard of the American Society for Testing and Materials, the IS0 9237 standard of the International Organization for Standardization, and the Chinese national standard GBTT5453. These standards have detailed provisions for sample preparation, test conditions, data processing, etc. to ensure the scientificity and consistency of test results.


As a precision testing equipment, the automatic air permeability tester plays a vital role in testing the air permeability of textiles. Through scientific and rigorous testing methods, it can accurately evaluate the air permeability of fabrics and ensure product quality and effect. If you want to know more about this machine, please feel free to consult UTSTESTER.


Email: hello@utstesters.com

Direct: + 86 152 6060 5085

Tel: +86-596-7686689

Web: www.utstesters.com


Mechanisms, Testing, and Performance Analysis of Tear Strength in Textiles

2026-05-13

Introduction

Tearing is one of the most common forms of failure in textiles during actual use. Whether a jacket cuff gets caught on a tree branch, the knee of work pants is struck by a sharp object, or tent fabric is subjected to strong winds—these scenarios can all cause the fabric to tear rapidly along the yarn direction, starting from a localized notch.

Tear strength, as a core indicator for evaluating fabric durability and safety, directly impacts product lifespan and consumer safety. This article provides systematic technical guidance for textile testing laboratories by examining four key dimensions: failure mechanisms, testing methods, influencing factors, and instrument applications.


I. Physical Mechanisms of Tear Failure

1.1 The Nature of Tearing: Sequential Yarn Breakage

Unlike tensile failure, where an entire group of yarns bears the load simultaneously, tear failure exhibits significant stress concentration characteristics. When a notch exists at the fabric edge (e.g., a snag or cut), external force causes the yarns at the tip of the notch to first bear a load far exceeding the average. Once the first yarn breaks, the stress immediately transfers to the next yarn, creating a “domino-effect” chain of failures that ultimately results in rapid crack propagation.

During the tearing process, a characteristic stress triangle (Tearing Triangle) forms within the fabric:

- Vertex: The tip of the notch, where the single yarn currently breaking is located

- Base: The yarn system perpendicular to the tearing direction, which bears the primary load

- Hypotenuse: Adjacent yarns that are gradually drawn into the stress state


1.2 Factors Determining Tear Strength

Based on a mechanical analysis of fabric structure, tear strength primarily depends on the following factors:

1. Yarn tensile strength: Tear strength is directly proportional to the tensile strength of the yarn

2. Yarn elongation: The greater the elongation at break, the larger the area of the stress triangle, and the greater the number of yarns under stress, resulting in higher tear strength

3. Yarn coefficient of friction: Friction resistance between yarns affects stress transfer efficiency and the shape of the stress triangle

4. Fabric density and weave structure: Excessively high density may prevent yarns from sliding, thereby reducing tear strength


II. Testing Methodology and Interpretation of Standards

The most commonly used methods for testing fabric tear strength include the pendulum method (Elmendorf method), the tongue method (trouser method), and the trapezoidal method.

2.1 Pendulum Method (Elmendorf Method) — Dynamic Impact Test

Standards: GB/T 3917.1-2009, ISO 13937-1:2000, ASTM D1424-25

Test Principle: Based on the law of conservation of energy, the pendulum is raised to a predetermined height to acquire potential energy. Upon release, this potential energy is converted into kinetic energy to tear the specimen. By measuring the remaining swing angle of the pendulum after tearing the specimen, the energy consumed is calculated, thereby determining the tear strength.

Specimen Specifications: 63 mm × 100 mm rectangle with a 20 mm slit cut at the center

Scope of Application:

- ✓ Woven fabrics, nonwoven fabrics, laminated fabrics, pile fabrics, airbag fabrics

- ✓ Warp-knitted fabrics tested in the warp direction

- ✗ Weft-knitted fabrics, elastic fabrics, highly anisotropic fabrics

Technical Features:

- Fast testing speed (<1 second per test), simulating sudden tearing scenarios

- Force-time curve exhibits a typical sawtooth pattern, reflecting the process of a single yarn breaking

- Requires a multi-range pendulum (typically 200 gf–6400 gf); the test force should fall within 20%–80% of the range


2.2 Trouser Method (Single-Seam Method) — Constant-Speed Tensile Test

Standards: GB/T 3917.2-2009, ISO 13937-2:2000

Test Principle: A rectangular specimen is cut along the center of the short side to form a “trouser leg” shape. The two legs are clamped in the upper and lower grips of a tensile testing machine, respectively, and stretched at a constant rate (100 mm/min) while recording the force changes during the tearing process.

Data Collection Requirements: Divide the force-displacement curve into four equal segments. Discard the initial quarter and calculate the average of all peak values from the remaining three segments as the final result.

Differences from the Pendulum Method: The mechanisms of the two methods are similar, but the pant leg method involves slow, uniform tearing, whereas the pendulum method involves rapid impact tearing. For the same fabric, results from the pendulum method are typically slightly lower than those from the pant leg method.


2.3 Tongue Method (Double-Slit Method) — Bidirectional Tear Test

Standards: GB/T 3917.4-2009, ISO 13937-4:2000

Test Principle: Two parallel slits are cut into a rectangular specimen to form a tongue-shaped specimen. The tongues are clamped separately to keep the two cut lines parallel, and tensile force is applied along the cut lines to simulate a bidirectional tearing process.

Scope of Application: Widely used for various types of fabrics, including natural fibers, chemical fibers, and blended fabrics; particularly suitable for apparel fabrics and home textile products.


2.4 Trapezoidal Method — Multi-Yarn Synergistic Stress Test

Standards: GB/T 3917.3-2025 (New Edition), ASTM D5587

Test Principle: The specimen is cut into a trapezoidal shape with a central slit on the short side. The two non-parallel sides of the trapezoid are clamped, positioning the slit between the two jaws. During tensile testing, the tear propagates across the width of the specimen, causing a group of yarns to break sequentially under stress.

Technical Features:

- Unlike the single-yarn failure mechanism of the pendulum or single-tongue methods, the trapezoidal method exhibits multi-yarn cooperative tensile behavior

- Test values are typically significantly higher than those obtained by other methods (plain-weave cotton fabric: pendulum method < single-tongue method < double-tongue method < wing method < trapezoidal method)

- Suitable for thicker or high-strength fabrics, such as denim, industrial fabrics, and coated fabrics


2.5 Wing Method — Angular Variation Test

Standards: GB/T 3917.5-2009, ISO 13937-3:2000

Test Principle: Similar to the trapezoidal method, but the specimen is wing-shaped (isosceles triangle). By changing the clamping angle, the number of yarns subjected to force is adjusted.

Important Note: Although the wing-shaped method and the trapezoidal method belong to the same type of test, the test results cannot be directly compared due to differences in the angle of force application.


III. Guidelines for Selecting Test Methods

Principles for Method Selection:

1. Routine quality control: Give priority to the pendulum method (high efficiency) or the trapezoidal method (wide applicability).

2. Apparel products: The tongue method or pant method is recommended to simulate the forces encountered during actual wear.

3. Heavyweight/coated fabrics: The trapezoidal method must be used; the pendulum method may not be able to completely tear the fabric.

4. Arbitration Testing: Follow the method specified in the product standard; typically, the pant-shaped method or trapezoidal method is selected


IV. Key Factors Affecting Tear Strength

4.1 Raw Material Factors

Fiber Type: High-strength fibers (polyester, nylon) > natural fibers (cotton, wool). For fabrics of the same specification, the tear strength of polyester is typically 30–50% higher than that of cotton.

Yarn Structure:

- Plied yarn > Single yarn (twisting increases strength)

- Filament yarn > Staple fiber yarn (higher breaking strength)

- Textured yarn > Regular filament yarn (higher elongation, larger stress triangle)


4.2 Fabric Structure Factors

Fabric Density: There is an optimal density range. If density is too low, yarns are prone to slipping; if too high, yarns cannot slide to form stress triangles, which actually reduces tear strength.

Weave Structure:

- Plain weave < Twill weave < Satin weave (the fewer the interlacing points, the greater the yarn’s ability to slide)

- Knit fabrics typically have lower tear strength than woven fabrics (the loop structure is prone to deformation)

Post-processing Techniques:

- Resin finishing: Improves dimensional stability but reduces yarn slippage, resulting in a 20–40% decrease in tear strength

- Coating finishing: The coating penetrates yarn gaps, restricting yarn movement; evaluation requires the trapezoidal method

- Softening finishing: Increases yarn lubricity, promotes stress distribution, and can enhance tear strength


V. Industry Applications

Key Application Areas

Protective clothing: Firefighting suits and chemical protection suits require warp/weft tear strength ≥100 N (GB 24539-2021)

Outdoor gear: Tent and jacket fabrics must be evaluated for both tear strength and seam performance

Industrial Textiles: Geotextiles and filtration materials are evaluated using the trapezoidal method, with a requirement of ≥250 N (GB/T 17634)

Automotive Interiors: Airbag fabrics are tested using the pendulum method, with a requirement of ≥200 N in both warp and weft directions (ISO 13937-1)


Conclusion

Textile tear strength testing is a comprehensive discipline involving materials mechanics, structural engineering, and standardization technology. From the rapid impact of the pendulum method to the multi-yarn interaction of the trapezoidal method, different testing methods reveal distinct mechanisms by which fabrics resist tearing.

If you require technical consultation regarding specific fabric types or testing methods, please contact the UTSTESTER technical team for customized solutions.


Email: hello@utstesters.com

Direct: + 86 152 6060 5085

Tel: +86-596-7686689

Web: www.utstesters.com


Which Way Should a Diamond Blade Spin? The Ultimate Direction Guide to Avoid Failure

2026-05-13


In the fast-paced world of construction, precision is everything. Even veteran operators can occasionally overlook a critical detail: the rotation direction of a diamond blade. If you find your brand-new blade cutting at a snail’s pace or generating excessive sparks, the first thing to check is—is it mounted correctly?


The Science of Unidirectional Design
Diamond blades are more than just steel discs. The segments consist of diamond crystals embedded in a metal bond matrix. During the factory "sharpening" process, a microscopic "tail" forms behind each diamond particle. Think of these as tiny support structures for the cutting edge.

When a blade spins in reverse, the impact force hits the diamond crystals from the unsupported side. This leads to:

Diamond Glazing: The crystals get polished smooth rather than biting into the material.
Extreme Overheating: Friction increases exponentially, softening the metal bond.

Segment Loss: For non-laser-welded blades, reverse stress can cause segments to fly off, posing a major safety hazard.


How to Identify the Correct Direction on a SANG Blade
Follow the Arrow: Every SANG blade features a clearly laser-etched or printed arrow on the steel core. Ensure this aligns with the arrow on your machine's safety guard.
Inspect the "Diamond Tails": If the markings have worn off, look at the segments with a magnifying glass. The "comet tail" trail behind the diamond grit indicates the direction opposite to the rotation.
Summary: Never Compromise on Direction Mounting a blade backwards can reduce cutting efficiency by 80% and cut the tool’s lifespan in half within minutes. Always double-check before you pull the trigger.

Analysis of Factors Affecting Fabric Water Vapor Permeability

2026-05-09

I. What Is Fabric Water Vapor Permeability?


Fabric water vapor permeability refers to a fabric’s ability to allow water vapor to pass through it, and it is one of the core indicators for evaluating the comfort of functional textiles. During physical activity, the skin continuously evaporates moisture (sweat). If the fabric cannot promptly expel this water vapor, a hot and humid microenvironment will form on the skin’s surface, leading to discomfort.


Water vapor permeability and water repellency together constitute the dual standards of “breathability” and “protection” for outdoor functional apparel. An excellent piece of functional apparel must both block the intrusion of external liquid water and rapidly expel water vapor from the body—this is precisely where the value of water vapor permeability research lies.


II. Testing Methods for Water Vapor Permeability


1. Desiccant Method (Positive Cup Method)

Standards: GB/T 12704.1, ASTM E96, JIS L1099 A-1

Principle: A desiccant (anhydrous calcium chloride) is placed in a moisture permeability cup, and the test sample is sealed at the cup opening. After being kept in a constant temperature and humidity environment for a specified period, the moisture permeability is calculated by measuring the weight gain of the desiccant.

Features: The test conditions are mild and closely resemble actual wearing conditions, making it the most commonly used testing method in China.


2. Evaporation Method (Water Method, Inverted Cup Method)

Standards: GB/T 12704.2, ASTM E96 BW, JIS L1099 B-1

Principle: A specific volume of distilled water is placed in a moisture transmission cup. After sealing the sample, the cup is inverted. Water vapor passes through the sample and evaporates outward; the moisture transmission rate is calculated by measuring the decrease in water mass within the cup.

Features: Testing conditions are relatively harsh, simulating a high-humidity environment, making it suitable for waterproof and breathable fabrics.


3. Sweating Guarded Hotplate Method

Standards: ISO 11092, GB/T 11048

Principle: A porous metal plate is used to simulate skin perspiration. The energy required to maintain a constant temperature is measured, directly yielding the fabric’s moisture resistance (Ret) and water vapor transmission index (imt).

Features: This method more closely approximates actual human physiological conditions and is considered the “gold standard” for evaluating thermal and moisture comfort.


III. Key Factors Affecting the Moisture Permeability of Fabrics


(Ⅰ) Fiber Raw Material Factors


1. Moisture Absorption of Fibers

The moisture absorption of fibers is the foundation for determining moisture permeability. Based on how fibers interact with water, they can be classified as follows:


- Hydrophilic fibers: cotton, viscose, wool, silk, etc. The molecular structure of these fibers contains hydrophilic groups (-OH, -COOH, -NH₂), which can adsorb water molecules via hydrogen bonding and transport them through diffusion within the fiber. Fibers with strong moisture absorption typically exhibit better moisture vapor permeability.

- Hydrophobic fibers: Synthetic fibers such as polyester, nylon, and polypropylene. These fibers do not absorb water themselves; water vapor is primarily transported through the pores in the gaps between fibers. Although the moisture vapor transmission capacity of a single fiber is limited, excellent moisture vapor transmission performance can be achieved through specialized structural designs.


2. Fiber Fineness and Cross-Section Shape


- Fiber fineness: The finer the fiber, the larger the specific surface area, and the more dense the capillary network formed between fibers, which facilitates the conduction of water vapor. Fabrics made from ultra-fine fibers (<0.5 dtex) typically exhibit superior moisture vapor transmission performance.

- Cross-sectional Shape: Fibers with non-circular cross-sections (such as cross-shaped, trefoil-shaped, or hollow fibers) can form more pore channels compared to circular fibers, thereby increasing the pathways for water vapor transmission. For example, hollow polyester fibers not only reduce weight but also significantly enhance moisture permeability and thermal insulation.


(II) Yarn Structure Factors


1. Yarn Twist

Twist directly affects the density and porosity of the yarn:


- Low-twist yarn: The yarn is loose, with large gaps between fibers, resulting in low resistance to water vapor transmission and good moisture permeability. However, the yarn has lower strength and reduced abrasion resistance.

- High-twist yarn: The yarn is compact, with reduced gaps between fibers, leading to increased resistance to water vapor transmission and reduced moisture permeability. However, the yarn has high strength, and the fabric feels stiff and crisp.


2. Yarn Blend Ratios


- Cotton/Polyester Blends: Cotton fibers provide moisture absorption and wicking capabilities, while polyester provides strength and quick-drying properties. When the cotton content is between 40% and 60%, moisture permeability and durability achieve a good balance.

- Wool/Nylon Blends: The natural moisture-absorbing properties of wool combined with the strength of nylon are commonly used in high-end outdoor apparel.


(III) Fabric Structure Factors


1. Fabric Density and Tightness


- Increased Density: Warp and weft yarns are arranged more tightly, reducing fabric porosity, increasing resistance to water vapor transmission, and lowering moisture permeability.

- Decreased density: Fabric porosity increases, improving moisture vapor permeability, but this may lead to reduced wind resistance and insufficient strength.


2. Fabric Thickness

Fabric thickness is inversely correlated with moisture vapor permeability: the diffusion resistance that water vapor must overcome to pass through the fabric is directly proportional to its thickness.
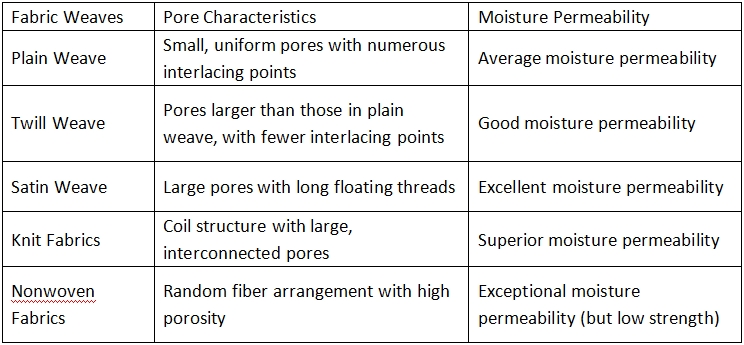

3. Weave Structure

The pore morphology formed by different weave structures varies significantly:


4. Multi-layer Composite Structures

Modern functional apparel often employs multi-layer composite designs:


- Two-layer fabrics: The outer layer is windproof and waterproof, while the inner layer wicks away moisture and sweat; the “pump effect” created by the pores between the layers enhances moisture vapor permeability.

- Three-layer composites: Fabric + waterproof and breathable membrane + lining. The membrane’s microporous structure allows water vapor molecules to pass through while blocking liquid water.


(IV) Post-processing Factors


1. Coating Treatments

Coating is a key method for modifying moisture vapor permeability:


- PU Coating: Standard PU coatings block fabric pores, significantly reducing moisture vapor permeability. However, microporous PU or hydrophilic PU coatings can maintain a certain level of moisture vapor permeability while retaining waterproofing properties.

- Microporous PTFE Membrane: Features extremely high porosity and very small pore sizes, offering high moisture vapor transmission rates and water pressure resistance.

- Non-porous hydrophilic membranes: These utilize a “adsorption-diffusion-desorption” moisture transmission mechanism via hydrophilic groups on the molecular chains. While their moisture permeability is slightly lower than that of microporous membranes, they offer better wash resistance.


2. Water-repellent and moisture-permeable finishing agents

- Fluorocarbon compounds: These impart water- and oil-repellent properties to fabrics but have a certain negative impact on moisture permeability.

- Silicone-based compounds: Form a breathable film on the fiber surface, with minimal impact on moisture permeability.

- Nanotechnology treatments: Such as nano-SiO₂ and TiO₂, which impart special functions while maintaining porosity.


3. Moisture-Wicking Finishes

Treating hydrophobic synthetic fiber fabrics with hydrophilic finishing agents (such as polyether-based or polyacrylic-based compounds):


- The finishing agents form a hydrophilic layer on the fiber surface, improving surface wettability.

- A wicking effect is created, rapidly transporting sweat from the skin side to the outer layer for evaporation.

- Moisture vapor transmission can be increased by 20%–40%, while maintaining the quick-drying properties of synthetic fibers.


(V) Environmental Factors


Both moisture vapor transmission testing and actual use are significantly influenced by environmental conditions:


1. Temperature

- Rising temperature: The kinetic energy of water vapor molecules increases, accelerating diffusion; simultaneously, fibers expand after absorbing moisture, enlarging their pores. Moisture vapor transmission rate increases significantly with rising temperature.


2. Relative Humidity

- High-humidity environment: The concentration gradient of water vapor on both sides of the sample decreases, reducing the driving force and lowering the moisture vapor transmission rate.

- Low-humidity environments: The concentration difference is large, resulting in high moisture vapor transmission rates.

- Isothermal and isohygric conditions: When the temperature and humidity on both sides of the sample are identical, the moisture vapor transmission rate is zero.


3. Wind Speed

- Increased wind speed accelerates the loss of water vapor from the sample’s surface, maintaining a higher concentration gradient and thereby increasing the moisture vapor transmission rate.

- In actual outdoor wear, wind speed is a key variable affecting perceived comfort.


IV. Balancing Moisture Permeability with Other Functions


1. Moisture Permeability vs. Water Resistance

Conflict: Water resistance requires extremely small or closed fabric pores, while moisture permeability requires open pores.

Solutions: Microporous membrane technology, hydrophilic non-porous membranes, and high-density weaving techniques (such as high-density fabrics made from ultra-fine fibers).


2. Moisture Permeability vs. Windproofing

Conflict: Windproofing requires a tightly woven fabric structure, while moisture permeability requires unobstructed pores.

Solutions: Multi-layer composite structures, membrane technology, and adding a windproof fabric layer on the outer side of the moisture-permeable membrane.


3. Moisture Permeability vs. Thermal Insulation

Conflict: Thermal insulation requires a layer of still air (loose structure), but excessive thickness reduces moisture permeability.

Solutions: Hollow fibers, 3D knitted structures, and phase-change materials for temperature regulation.


Conclusion


Fabric moisture vapor permeability is a complex system involving multiple interacting factors, spanning disciplines such as fiber science, textile engineering, polymer materials, and heat and moisture transfer.

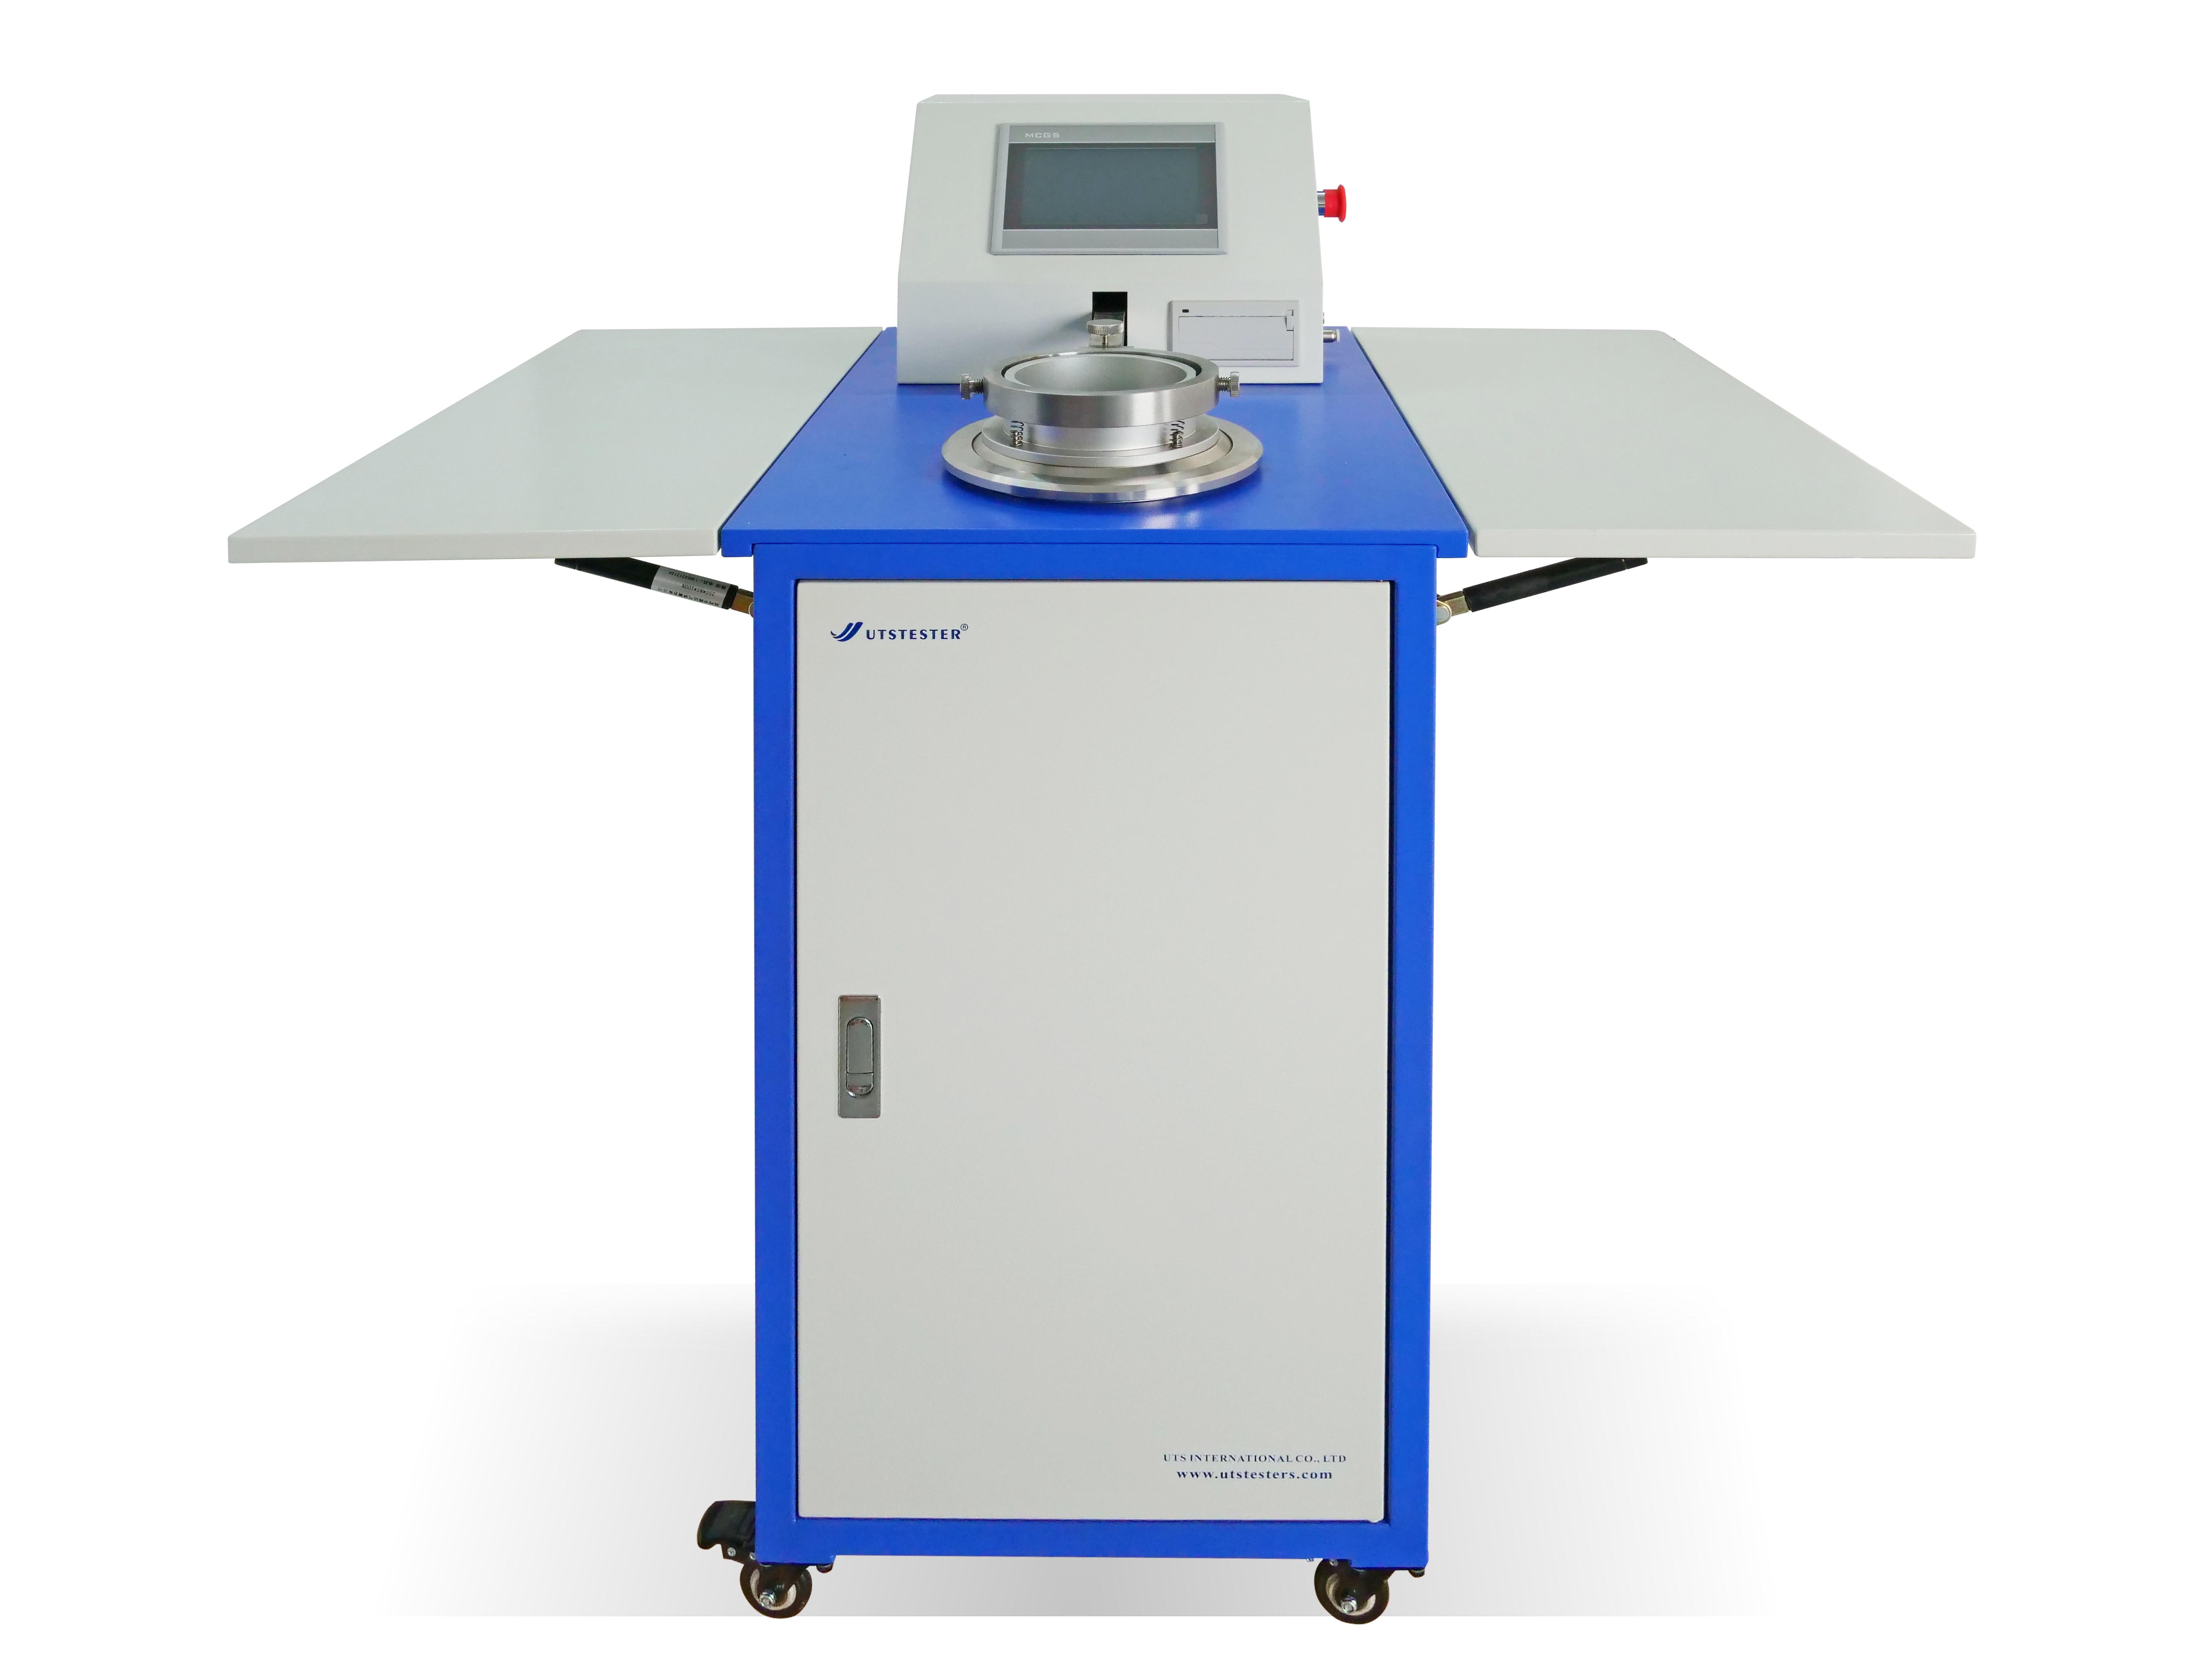
UTSTESTER provides precise moisture vapor permeability testing equipment. If you encounter any issues during moisture vapor permeability testing, please feel free to contact our technical team at any time.

Water Vapour Permeability Tester


Email: hello@utstesters.com

Direct: + 86 152 6060 5085

Tel: +86-596-7686689

Web: www.utstesters.com


The Significance of the Wash Fastness Tester

2026-05-08

Throughout the entire textile production and trade chain, color is one of the most intuitive elements perceived by consumers. However, when a brightly colored new garment fades or bleeds after just a few washes, it not only affects the wearing experience but may also pose a risk to consumer health. By scientifically simulating washing conditions, the color fastness to washing tester provides an accurate and quantifiable basis for evaluating the color durability of textiles.


I. What Is Wash Fastness? Why Is It So Important?


Color fastness refers to the ability of dyed or printed textiles to resist various external factors (such as washing, friction, perspiration, and light exposure) during processing or use. Among these, wash fastness specifically measures a textile’s ability to maintain color stability during the washing process, encompassing two aspects:


- Color Change: The degree of color change in the sample itself after washing

- Staining: The extent to which the sample’s color migrates to adjacent fabrics (such as multi-fiber interlinings)


The quality of colorfastness directly affects a product’s durability, aesthetic appeal, and the consumer’s user experience. Products that fail colorfastness tests may experience issues such as fading or staining during wear or washing. These problems not only compromise appearance but may also release harmful dye molecules or heavy metal ions, which can be absorbed through the skin and pose a potential threat to human health.


II. Operating Principle of the Color Fastness to Washing Tester


The core operating principle of the color fastness to washing tester is to simulate standardized domestic or commercial washing processes. During testing, the textile sample is bonded to a specified standard backing fabric, placed in a standard washing solution, and subjected to mechanical agitation for a specified duration at a specified temperature. After rinsing and drying, the degree of color change and color transfer is evaluated using a gray scale.

Key Parameters:


Modern high-end testing instruments are typically equipped with programmable control systems, high-precision PID temperature control modules, solid-state relay heating systems, and interchangeable test vessels (500 mL or 1200 mL options), ensuring that temperature fluctuations are kept within ±1°C and effectively eliminating temperature “overshoot.”


III. The Significance of Wash Fastness Testers


1. Ensuring Consumer Safety and Health


Textiles that fail colorfastness tests may release dye molecules when exposed to rain, sweat, or washing, which can be absorbed by the skin and may even contain harmful substances such as heavy metal ions. Through standardized testing, wash fastness testers ensure products comply with domestic and international safety requirements, including China’s GB standards, the EU REACH Regulation, and OEKO-TEX® certification, thereby safeguarding consumer health at the source.


2. Enhancing Product Competitiveness


In the highly competitive textile market, high colorfastness signifies greater durability and reliability. Through rigorous wash fastness testing, companies can:

- Select high-quality dyes and auxiliaries to optimize dyeing processes

- Reduce customer complaints and returns caused by fading or color bleeding

- Build brand reputation for quality and earn long-term consumer trust


3. Meeting International Regulations and Trade Access Requirements


Different countries and regions have strict regulatory requirements for textile colorfastness:

- China: GB/T 3921 “Textiles—Colorfastness Tests—Colorfastness to Soap Washing”

- International: ISO 105-C06 series

- North America: AATCC 61 (Soap Wash Fastness), AATCC 190

- Japan: JIS L0844

- UK/EU: BS EN ISO 105-C06


4. Optimize Production Processes and Cost Control


During the product development phase, colorfastness testing is used to evaluate the stability of dyes and processes. Using test data, technicians can:

- Assess the effectiveness of fixatives and optimize finishing processes

- Identify issues related to insufficient dye-fiber bonding

- Avoid significant financial losses resulting from discovering colorfastness non-compliance only after mass production


5. Coverage of a Wide Range of Textile Categories


The application scope of colorfastness to washing testers is extremely broad, suitable for:

- Natural fibers: cotton, linen, wool, silk, etc.

- Synthetic fibers: polyester, nylon, acrylic, spandex, etc.

- Blended and interwoven fabrics: various blended fabrics

- Finished product categories: apparel fabrics (shirts, denim, sportswear), home textiles (bed linens, curtains, towels), industrial textiles

- Other materials: leather, plastics, etc.


IV. Modern Wash Fastness Testers


With the continuous advancement of textile testing technology, modern wash fastness testers have exhibited the following trends:

Intelligence and Automation

- 7-inch color touchscreen: Features integrated Chinese and English interfaces, supporting one-click selection of test standards, parameter customization, temperature calibration, and data export

- Macro programming: Allows recording and saving of common test procedures to automate batch testing

- Intelligent Temperature Control Algorithm: Temperature fluctuations are maintained within ±1°C, ensuring testing accuracy


Dual-Mode and Modular Design

- Dual-Tank Independent Control: Allows simultaneous testing of two sets of samples under different temperatures or conditions, significantly improving testing efficiency

- Compatibility with Wet and Dry Cleaning Modes: By changing detergents and adjusting process parameters, the instrument covers dry cleaning standards such as ISO 105-D01 and AATCC 132

- Modular cup rack system: Interchangeable 500mL/1200mL test cups accommodate various sample sizes and standard requirements


Safety Protection and Durability

- Multiple safety protections: Low-water alarm, over-temperature alarm, door-open alarm, and dry-run protection

- 304/316 Stainless Steel Construction: Highly corrosion-resistant, suitable for long-term, high-frequency use

- Solid-State Relay Control: No mechanical contacts, stable temperature, silent operation, and long service life


Data Management and Traceability

- Test History Log: Stores temperature curves, test parameters, and results for easy quality traceability

- Data Export Function: Supports export via USB or network interface for convenient generation of test reports


Email: hello@utstesters.com

Direct: + 86 152 6060 5085

Tel: +86-596-7686689

Web: www.utstesters.com


Fabric Crease Recovery Testing Principles, Standards, and Applications

2026-04-24

I. What Is Fabric Crease Recovery?

Fabric crease recovery (also known as wrinkle recovery) refers to a fabric’s ability to automatically return to a smooth, flat state after creases are formed by external folding forces. This property directly affects a garment’s ability to maintain its appearance and its wrinkle-resistant qualities, making it one of the key indicators of fabric quality.

In everyday life, the core technical indicator behind concepts such as “non-iron shirts” and “low-maintenance fabrics” is crease recovery. Excellent crease recovery performance means:

Fabrics do not develop noticeable wrinkles easily after wearing; they require little or no ironing after washing; and they maintain a smooth, crisp appearance over the long term.


II. Testing Principles of Crease Recovery

2.1 Testing Mechanism

Crease recovery testing simulates the folding-recovery process of fabric during actual use:

1. Applying deformation: Fold the fabric sample according to specified procedures, apply a standard pressure (typically 500g), and maintain it for a set duration (typically 5 minutes)

2. Releasing stress: After removing the pressure, allow the sample to recover freely

3. Measure the recovery angle: Measure the angle between the sample’s folded surface and the horizontal plane (recovery angle); a larger angle indicates better recovery.


2.2 Two Main Testing Methods

Horizontal Method: The sample is folded horizontally, and vertical pressure is applied; this is the method commonly used in international standards.

Vertical Method: The sample is folded while suspended vertically; this method is required by specific standards.


III. Detailed Explanation of Testing Standards

BS EN 22313 / ISO 2313

- Specifies the test procedure for the horizontal method

- Applicable to all types of woven fabrics

- Test conditions: 500 g pressure, 5-minute loading time

AATCC 66

- Uses the vertical method for testing

- Widely used in the North American market

- Data differs from the ISO method; direct comparison is not possible

GB/T 3819

- Equivalent to ISO 2313

- Applicable to crease recovery testing of all types of textiles

- The mainstream method in China’s textile testing laboratories


IV. Testing Equipment and Operating Procedures

4.1 Core Equipment

Components of the Crease Recovery Tester

Pressure Application Device: Precision pressure weight (500 g ± 5 g)

Timing System: Precise control of pressure application and recovery times

Angle Measurement: Dedicated protractor or digital measurement system

Environmental Control: Standard atmospheric conditions (20 ± 2°C, 65 ± 2% RH)


4.2 Standard Test Procedure

Step 1: Sample Preparation

Cut test specimens of specified dimensions from the sample; take several specimens in both the warp and weft directions (typically 5 each); condition them under standard atmospheric conditions for at least 24 hours.

Step 2: Folding and Pressing

Fold the specimen in half with the right side facing inward (or as required by the standard); place it in the pressing device and apply a pressure of 500 g; maintain this pressure for 5 minutes ± 5 seconds.

Step 3: Free Recovery

Quickly release the pressure and transfer the test specimens to the recovery device; allow the specimens to recover freely for 5 minutes ± 5 seconds

Step 4: Angle Measurement

Measure the angle between the two surfaces using a dedicated protractor; record the recovery angle value (accurate to 1 degree)

Step 5: Result Calculation

Calculate the average recovery angle for the warp and weft directions separately; calculate the total recovery angle (warp + weft) if necessary


V. Key Factors Affecting Crease Recovery

5.1 Fiber Factors

Polyester (polyester fiber): Excellent recovery, high elastic modulus, and molecular chains that readily return to their original shape

Wool: Good recovery, excellent elastic recovery properties

Nylon: Moderate recovery, performance decreases significantly after moisture absorption

Cotton: Poor recovery, high rigidity of cellulose molecules, prone to forming hydrogen bonds that fix creases

Rayon: Poor recovery, low wet modulus, extremely prone to wrinkling

5.2 Fabric Structure Factors

Fabric Density: Denser fabrics generally exhibit better recovery

Yarn Twist: High-twist yarns help improve recovery

Fabric Weave: Plain < Twill < Satin (recovery increases in this order)

Fabric Thickness: Thinner fabrics are more prone to permanent wrinkles


VI. Application and Interpretation of Test Results

6.1 Classification of Recovery Angle Grades (for reference)


6.2 Anisotropy Analysis

The recovery angles of a fabric’s warp and weft directions often differ:

1. High warp recovery angle: Indicates good wrinkle resistance in the longitudinal direction.

2. High weft recovery angle: Indicates good wrinkle resistance in the transverse direction.

3. Significant difference between the two: Suggests that the fabric may have uneven weaving or finishing.


6.3 Practical Application Guidelines

Recommendations for apparel manufacturers:

1. Business shirt fabrics: Recommended total recovery angle (warp + weft) ≥ 250°

2. Casual pants fabrics: Recommended total recovery angle ≥ 220°

3. Home textile products: Recovery angle requirements may be appropriately relaxed


VII. Frequently Asked Questions and Solutions

Q1: Why do test results for the same fabric vary when tested multiple times?

Possible causes:

1. Insufficient acclimatization of the test specimen

2. Differences in sampling location (performance varies between the fabric edge and the center)

3. Inconsistent testing procedures (application and release speeds)

Solution: Strictly adhere to standard conditions, increase the number of test specimens, and calculate the average


Q2: How should data from ISO methods be converted to AATCC methods?

Note: The two methods are based on different principles, so there is no exact conversion formula. Recommendations:

1. For exports to Europe and the U.S.: Prioritize AATCC 66 testing

2. For general trade: Use ISO 2313 or GB/T 3819

3. For internal quality control: Use a single method consistently and establish a company database


Q3: How can fabric crease recovery be improved?

Technical approaches:

1. Select fibers with inherent elasticity (e.g., polyester-spandex blends)

2. Optimize fabric structure (appropriately increase density)

3. Apply resin finishing or liquid ammonia finishing

4. Develop new types of elastic composite yarns

Crease Recovery Tester and Loading Device M022A

Email: hello@utstesters.com

Direct: + 86 152 6060 5085

Tel: +86-596-7686689

Web: www.utstesters.com


Flame-Retardant Textiles An Overview of Testing Methods and Standards

2026-04-24

In the textile industry, flame-retardant textiles are being used in an increasingly wide range of applications—from industrial protective workwear and decorative fabrics in public spaces to infant and children’s clothing and vehicle interiors. Their flame-retardant properties directly impact personal safety and environmental safety. This article outlines the testing methods, core standards, and key considerations during the testing process for flame-retardant textiles, providing a reference for industry professionals.


I. Testing Methods for Flame-Retardant Textiles


The core of testing flame-retardant textiles lies in evaluating the fabric’s combustion behavior when exposed to a flame source, including key indicators such as flame spread rate, after-flame time, smoldering time, degree of damage, and smoke emission. Currently, mainstream testing methods are primarily divided into five categories, each tailored to different application scenarios with distinct testing principles and focuses.


(1) Vertical Burning Test

The vertical burning test is the most commonly used and fundamental flame-retardant testing method, suitable for most apparel textiles, protective clothing, bedding, and similar products. Its core principle is to simulate the combustion characteristics of fabric in a vertically suspended state. The testing principle involves clamping the test specimen vertically in place and applying a standard ignition source (typically a Bunsen burner with a flame height of 40 mm) to the lower edge of the specimen for a specified duration (usually 12 seconds) before removing the flame. The specimen’s after-flame time, smoldering time, and the length of damage after combustion are then recorded to assess the fabric’s flame-retardant performance.

The advantages of this method include its simplicity and broad applicability. It provides an intuitive reflection of the fabric’s flame-retardant performance under actual wearing or hanging conditions, making it the preferred method for factory-exit inspections and routine laboratory testing. Relevant standards include GB/T 5455-2014, ISO 15025, and ASTM D6413, among others; specifications regarding flame height, ignition duration, and pass criteria vary slightly across different standards.


(2) Horizontal Burning Test

The horizontal burning test is primarily suitable for lightweight textiles, decorative fabrics (such as curtains and tablecloths), and plastic-coated fabrics, simulating the burning scenario when the fabric is placed horizontally. The test principle involves placing the specimen horizontally on a specific stand, igniting it from one end with a flame source, observing the spread of the flame, and measuring the flame spread rate and the length of damage. Some standards also require recording whether molten droplets are produced during combustion.

Compared to the vertical burning method, the horizontal burning method places greater emphasis on evaluating a fabric’s flame spread capability when laid flat, making it particularly suitable for textiles that are typically placed horizontally during daily use. Common standards include GB/T 2408-2021, ASTM D635, and ISO 6941. Among these, GB/T 2408-2021 accommodates both vertical and horizontal combustion modes, meeting the testing requirements for a wide range of fabrics.


(3) 45-Degree Combustion Method

The 45-degree combustion method is primarily designed for hanging textiles, such as curtains, drapes, and stage curtains. It simulates the combustion characteristics of these fabrics when hung at an angle. The testing principle involves securing the test specimen at a 45-degree angle to the horizontal plane, igniting it from the bottom, measuring the burn time and extent of damage, and evaluating the flame spread rate along the inclined surface of the fabric.

This method closely mirrors the actual usage scenarios of hanging textiles, accurately reflecting the diffusion patterns of flames on inclined surfaces and avoiding result discrepancies caused by mismatched testing angles. Common standards include the U.S. NFPA 701 (divided into the stricter Class 1 and the general Class 2) and China’s GB/T 5456-2015. Among these, NFPA 701 serves as the core reference standard for flame-retardant testing of hanging textiles worldwide and is widely used in the inspection of export products.


(4) Limiting Oxygen Index (LOI) Method

The Limiting Oxygen Index (LOI) method is a quantitative testing method suitable for the precise evaluation of textile flame-retardant performance, particularly for quality control during the R&D phase and for high-end products. The testing principle involves placing the sample in an environment of a nitrogen-oxygen mixture and gradually adjusting the oxygen concentration until the minimum oxygen concentration required for the sample to sustain combustion (i.e., the Limiting Oxygen Index, LOI) is determined. A higher value indicates stronger flame-retardant performance of the fabric.

Generally, an LOI ≥ 28% is classified as flame-retardant fabric, while an LOI ≤ 20% indicates flammable fabric. The advantage of this method lies in its precise and quantifiable test results, which provide scientific data support for product development and standard formulation. Relevant standards include the international ISO 4589-2, China’s GB/T 5454-1997, and the U.S. ASTM D2863, among others. This method serves as a crucial testing tool for textile enterprises to enhance product quality.


(5) Supplementary Testing for Special Applications

In addition to the four basic methods described above, flame-retardant textiles intended for special applications must undergo specific testing:

1. Smoke Density Testing: Simulates the smoke emission from burning fabrics in enclosed spaces (such as subways and airplanes). Smoke density (Ds value) is measured using the light attenuation method to prevent asphyxiation caused by smoke during a fire. Common standards include GB/T 8627-2007 and ISO 5659-2;

2. Thermal Radiation Test: Designed for industrial protective clothing and fabrics used in high-temperature environments, this test simulates high-temperature radiation scenarios to evaluate the fabric’s thermal protection performance (TPP value). Relevant standards include GB 8965.1-2023 and ISO 13506;

3. Wash fastness testing: Evaluates the durability of flame-retardant properties in fabrics after repeated washing. Typically, fabrics are processed according to the washing procedures specified in GB/T 8629-2017, followed by basic flame-retardant testing to ensure the fabric remains compliant even after long-term use;

4. Smoke toxicity testing: For interior fabrics used in buildings and vehicles, this test measures the release of toxic gases during combustion to prevent secondary harm. Common standards include GB/T 20284-2006 and BS 6853.


II. Standards for Flame-Retardant Textiles


(1) GB Series

GB/T 17591-2025, implemented in 2025, is the latest core standard. It replaces the 2006 edition and further refines testing criteria and classification requirements.

1. GB/T 17591-2025 “Flame-Retardant Fabrics”: A core recommended standard covering flame-retardant fabrics for apparel, decoration, and industrial use. It introduces eight new terms, including burn length, smoke density, and thermal protection performance values. It adjusts test items and performance requirements for different applications—such as interior decoration, vehicle interiors, and flame-retardant protective clothing—including the addition of Class B3 requirements for interior decoration fabrics and smoke density grading for automotive interior fabrics.

2. GB/T 5455-2014 “Textiles—Flame Resistance—Determination of Vertical Burn Length, Smoldering Time, and Afterglow Time”: A recommended standard corresponding to the vertical burning method, applicable to routine flame-retardant testing of various textiles. It specifies sample preparation, testing procedures, and acceptance criteria, and is a commonly used standard for factory-exit testing;

3. GB 8965.1-2023 “Protective Clothing—Flame-Retardant Protection—Part 1: Flame-Retardant Clothing”: A mandatory standard for industrial flame-retardant protective clothing. It specifies test items such as vertical burning and thermal radiation, introduces new Class B2 and B3 requirements, and adjusts metrics such as burn length and after-flame time. It applies to protective workwear used in open-flame and high-temperature environments, such as firefighter uniforms and welding workwear;

4. GB 31701-2015 “Technical Specifications for the Safety of Textile Products for Infants and Children”: A mandatory standard for infant and children’s clothing. It requires flame-retardant performance to meet Class B standards (burn length ≤ 200 mm, after-flame time ≤ 5 s) and strictly prohibits the use of flammable fabrics to ensure children’s safety;

5. GB 8624-2012 “Classification of Fire Performance of Building Materials and Products”: Applicable to flame-retardant textiles used in construction (such as curtains and carpets), this standard classifies fire performance into four levels: A (non-combustible), B1 (difficult to ignite), B2 (combustible), and B3 (flammable), and specifies the testing requirements and acceptance criteria for each level.


(2) International and Regional Standards

1. ISO Series Standards (Internationally Recognized): Core standards include ISO 4589-2 (Limiting Oxygen Index Method), ISO 6940 (Vertical Burning), ISO 6941 (Horizontal Burning), and ISO 15025 (Vertical Burning, applicable to apparel fabrics), with relatively universal performance requirements;

2. ASTM Series Standards (U.S. Standards): Published by the American Society for Testing and Materials (ASTM), these standards are highly targeted. Commonly used standards include ASTM D6413 (Vertical Burning of Textiles), ASTM D3801 (Flame Retardancy of Children’s Sleepwear), ASTM E84 (Smoke Density of Textiles for Construction), and ASTM F1959 (Arc Flash Protection Testing). Among these, 16 CFR 1615/1616 is the mandatory flame retardancy standard for children’s sleepwear, with extremely strict requirements: it must pass the vertical burning test with a burn length ≤ 17.8 cm;

3. EN Series Standards (European Union Standards): Unified European standards applicable to products sold in the EU market. Key standards include EN 13501-1 (classification of combustion performance of construction products, rated from Class A to Class F based on a combined assessment of smoke generation and melting droplets), EN ISO 11925-2 (small flame test), and EN 13773 (curtain fabrics). These standards impose more detailed requirements regarding smoke density and toxic gas emissions, which companies exporting to the EU must strictly adhere to;

4. Standards for Other Regions: The UK BS series (BS 5852 for flame-retardant testing of furniture fabrics, BS EN 11611 for welding protective clothing) and the Japanese JIS series (JIS L 1091 for flame-retardant testing of textiles). Select the appropriate standards based on the requirements of the target market.


III. Applicable Scenarios and Precautions


(1) Selection of Applicable Scenarios

1. Worn textiles (clothing, sleepwear): The vertical burning test (GB/T 5455, ASTM D6413) should be prioritized. Children’s clothing must additionally comply with mandatory standards such as GB 31701 and 16 CFR 1615/1616;

2. Hanging decorative fabrics (curtains, drapes): Prioritize the 45-degree burn test (NFPA 701, GB/T 5456). Fabrics for architectural use must also meet the classification requirements of GB 8624 and EN 13501-1;

3. Industrial protective clothing: Select the vertical burn test combined with thermal radiation testing (GB 8965.1, ASTM F1959) to ensure protective performance in high-temperature and open-flame environments;

4. Vehicle interiors (automobiles, aircraft, trains): Combine the vertical burning test, smoke density test, and smoke toxicity test to comply with standards such as GB/T 17591-2025 and EN 45545-2; for aircraft and train interior fabrics, additional smoke density rating assessments are required;

5. Product R&D/High-End Customization: Prioritize the limiting oxygen index method (ISO 4589-2, GB/T 5454) to precisely quantify flame-retardant performance and optimize product formulations.


(2) Key Testing Considerations

1. Sample Preparation: Samples must be representative, drawn from different batches and locations, and meet standard dimensional requirements; They must also undergo standard pre-treatment (e.g., conditioning) to ensure the samples are in a stable state;

2. Environmental Control: Test environment temperature and humidity must comply with standard specifications;

3. Equipment Calibration: Testing instruments (e.g., combustion testers, oxygen index analyzers) must be calibrated regularly to ensure the accuracy of parameters such as flame height, oxygen concentration, and temperature measurements;


IV. The Importance of Flame Retardant Testing Instruments


Professional flame retardant testing instruments must be compatible with various testing methods and standards. They can accurately measure key indicators such as after-flame time, smoldering time, limiting oxygen index, and smoke density. Characterized by ease of operation, data accuracy, and high stability, these instruments not only meet the needs of enterprises for factory-exit inspections and R&D testing but also provide reliable testing equipment support for third-party testing institutions.

Email: hello@utstesters.com

Direct: + 86 152 6060 5085

Tel: +86-596-7686689

Web: www.utstesters.com


Dry Electrode Process The Key to Mass Production of High-Performance Solid-State Battery

2026-04-22

In all-solid-state batteries, the liquid electrolyte is replaced by a solid-state electrolyte membrane. Consequently, the front-end production process requires the preparation of this solid electrolyte film in addition to the traditional positive and negative electrode sheets. This process is a critical link in the battery manufacturing workflow, directly determining the performance and quality of the final cell. While the wet process currently dominates solid-state battery production lines, the dry process is increasingly becoming the mainstream direction for next-generation solid-state battery front-end technology, thanks to its combined advantages in cost, process efficiency, and material compatibility.


01. Key Upgrades in Solid-State Battery Pre-Forming Production

The manufacturing process for solid-state batteries fundamentally differs from that of traditional liquid batteries. The front-end film preparation segment is the critical, transitional phase in the battery manufacturing process. This stage directly dictates the finished cell's energy density, rate performance, and cycle life. In all-solid-state batteries, the solid-state electrolyte membrane replaces the liquid electrolyte. Therefore, front-end preparation must include not only the conventional positive and negative electrode sheets but also the solid-state electrolyte film. This fundamental change introduces new challenges and simultaneously presents opportunities for process upgrading.

dry electrode sheet

02. Technological Transformation: The Leap from Wet to Dry Process

Current solid-state battery front-end preparation processes are mainly categorized into two technical routes: wet and dry. The wet process still relies on the solvent system of traditional liquid batteries, where electrode or electrolyte materials are mixed with a binder to form a slurry, coated, and then dried to complete film formation.

While this process is relatively mature, it has inherent drawbacks: it requires the use of large amounts of toxic organic solvents (such as NMP), necessitates high-energy-consumption steps for drying and solvent recovery, and restricts the application of certain cutting-edge materials sensitive to solvents.

In contrast, the dry process innovates electrode manufacturing by eliminating the use of solvents and the subsequent drying step. The dry process relies more heavily on high-shear dry mixing and fibrillation equipment to achieve uniform material dispersion and pre-forming, followed by multi-roll pressing to complete the film formation directly.


The core advantages of dry film formation technology are evident across three dimensions:

• Cost Efficiency: By omitting the coating, drying, and solvent recovery stages, equipment investment is lower, energy consumption is reduced, and overall cell manufacturing costs can be reduced by approximately 18%.

• Performance Enhancement: The dry process effectively increases the active material's compaction density, leading to an energy density increase of about 20%. SAIC Group's semi-solid-state battery, integrated into its MG4 model, has achieved a system energy density of 400Wh/kg, supporting a 12-minute fast charge for 400 km.

• Environmental and Material Compatibility: The dry process eliminates the need for toxic solvents, solving the environmental pollution issues of the traditional wet process. Concurrently, it enables the application of more cost-effective materials (such as manganese-based cathodes).


03. Technology Matrix: Diversified Paths for Dry Film Formation

Dry film formation is not a single process but a matrix encompassing various technical routes. Currently, the more representative dry electrode preparation technologies primarily include six types:

• Fibrillation Method: Uses high shear force to fibrillate the binder, enabling it to tightly encapsulate active materials and conductive agents, forming a self-supporting electrode film. This process demands extremely high shear force and temperature control capabilities from the equipment.

• Dry Spray Deposition: Utilizes charged powder, which is uniformly deposited onto the current collector under an electric field, followed by hot pressing to melt and fix the binder, forming a self-supporting film.

• Other Methods: Vapor deposition, hot-melt extrusion, direct pressing, and 3D printing are applied based on different material characteristics and application scenarios.

These different paths vary in technical principles, applicable materials, film-forming capability, and equipment complexity, and are suited for different applications such as large-scale, flexible electrodes, small-sized devices, and thick electrode sheets.


Comparison of Major Dry Film Formation Technical Routes

Technical Route

Core Principle

Applicable Scenarios

Equipment Complexity

Fibrillation Method

High shear force fibrillates binder to wrap active material

Large electrodes, all-solid-state batteries

High

Dry Spray Deposition

Electrostatic powder deposition followed by hot pressing

Flexible electrodes, complex shapes

Medium

Direct Pressing

Direct pressing and forming of powder material

Thick electrode sheets, experimental lines

Low

3D Printing

Layer-by-layer accumulation and forming

Small-sized devices, customized structures

High

The industry generally considers the Binder Fibrillation Method to exhibit superior performance stability and processability, positioning it as the emerging mainstream route.


04. Industrialization Challenges: Bridging the Gap from Laboratory to Mass Production

Despite the clear advantages of dry film formation, scaling from the laboratory to mass production faces numerous hurdles. Capacity and efficiency are paramount concerns. Dry coating capacity and speed still lag behind traditional wet processes, and uniformity and adhesion performance during wide-format spraying require significant improvement.

Coating uniformity and quality control present another major challenge. Non-uniform dry electrode coatings can create "hot spots" within the electrode, leading to accelerated battery performance degradation and potential safety risks.

Binder and material compatibility also need further optimization. Achieving uniform distribution of PTFE fibrils within the mixture while preventing damage to active material particles is essential. Furthermore, PTFE is unstable at low potentials and reacts irreversibly with lithium, which limits its application in negative electrodes.

Challenges on the equipment side are equally severe. The dry process imposes higher demands on core roller-pressing machinery. The performance and production efficiency of the calendaring machine as the core equipment are central to determining the dry process's viability for mass production.

TOB NEW ENERGY is actively working to address these challenges, aiming to control the binder content in the negative electrode to 0.7% and the positive electrode below 1.5% to achieve more efficient, low-cost film-forming performance.


05. Equipment Innovation: The Critical Force Driving Dry Process Implementation

Equipment typically spearheads the industrialization of solid-state batteries. In the realm of dry film formation, equipment innovation is the key driver for technological implementation.

• Front-End Process Equipment: Accounts for approximately 32% of the entire production line's value, including core equipment for high-efficiency mixing, material dispersion, coating, and high-shear treatment.

• Mid-End Process Equipment: Accounts for approximately 45% of the line's value, centered around high-efficiency stacking machine (25% of the line's value) and horizontal isostatic presses (13% of the line's value), covering the entire process from shaping to densification.

• Back-End Process Equipment: Accounts for approximately 23% of the line's value, including dry powder comprehensive testers and horizontal high-temperature fixture solutions for solid-state battery integrated cabinets, achieving high-voltage formation and capacity grading and assembly.


06. TOB NEW ENERGY: Providing Comprehensive Solutions from Laboratory to Mass Production

Addressing the industrialization opportunities and challenges of dry film formation technology, TOB NEW ENERGY leverages years of technical accumulation in battery manufacturing to offer customers a complete solution spanning from the laboratory to mass production.

Solutions for Laboratory-Scale Dry Electrode Lines

We provide a full suite of customized equipment and services for dry electrode experimental lines. Our developed Laboratory Jet Mill integrates miniaturization, intelligence, and high precision, suitable for experimental-grade powder preparation needed for the fibrillation of lithium battery dry electrode materials. The Lab Dry Electrode Film Forming Machine is a laboratory dry electrode research equipment that can be used for the powder to film forming process.

Laboratory Jet Mill

Lab Dry Electrode Film Forming Machine

Solutions for Pilot-Scale Production

We offer Dry Electrode Film Forming Machines that support various production line requirements, including equipment for GWh-level mass production capacity. Through precise tension control and thickness adjustment, we can achieve the preparation of dry electrode sheets as thin as 27μm or even thinner.

Dry Electrode Film Forming Machines

Solutions for Industrial Mass Production

For industrial mass production needs, we provide complete dry electrode production line solutions. Our system covers all processes, including controllable feeding, film formation, thinning, current collector compounding, and quality inspection. Product width can reach 1000mm, with a thickness range of 40-300μm, and is compatible with 2 to 6 dry electrode sheets operating in parallel for high-efficiency production.


Our technical team deeply understands every aspect of the dry film formation process and can provide customized process optimization solutions based on the client’s specific material systems (such as graphite/silicon-carbon negative electrodes, ternary/LFP positive electrodes, and various all-solid-state electrode materials) and equipment needs. On the materials front, we support our clients with cutting-edge battery materials, including specialized binders and modified conductive agents suitable for the dry process, ensuring optimal compatibility between materials and process.


Formation and Grading in Lithium-Ion Battery Manufacturing

2026-04-22

Formation and capacity grading are among the final and most critical stages in lithium-ion battery manufacturing. Although these steps occur after electrode fabrication and cell assembly, they strongly influence the electrochemical stability, safety performance, consistency, and lifetime of the final product. In industrial battery production lines, the formation process activates the battery for the first time, while the grading process evaluates and classifies the cells based on measurable electrical parameters.

From an engineering perspective, these operations are not simple charging and testing procedures. Each step — electrolyte filling, aging, formation, secondary filling, K-value evaluation, and capacity grading — is designed based on electrochemical mechanisms, mass transport behavior, gas evolution, and quality control requirements. In modern battery factories, the design of these processes must be integrated with the overall production line layout, equipment capability, and target performance specifications. For manufacturers building new facilities, these steps are typically implemented as part of a complete lithium battery production line solution, where formation systems, aging rooms, and grading machines are configured according to capacity and chemistry requirements.

This article provides a detailed engineering explanation of each step in the formation and capacity grading process, together with the physical and chemical reasons behind the operations.


battery formation and grading system


1. First Electrolyte Filling After Cell Assembly


After the electrode stack or jelly-roll is inserted into the cell casing, the first electrolyte filling operation must be performed. In industrial terminology, this step is calledfirst filling, because a second filling will be required later in the process.

During the first filling, the assembled cell is placed in a vacuum filling chamber. The chamber is evacuated to create negative pressure inside the cell. Once the internal pressure is sufficiently low, the electrolyte valve is opened, and the electrolyte flows into the cell due to the pressure difference. This method ensures that the electrolyte penetrates into the separator pores and electrode structure more efficiently than simple atmospheric filling.

The purpose of the first filling is not only to introduce electrolyte, but also to ensure uniform wetting of porous electrodes. Poor wetting can lead to high internal resistance, non-uniform SEI formation, and capacity loss in later stages.


2. High-Temperature Aging for Electrolyte Wetting


Cells cannot be charged immediately after the first filling. Anyone who has worked with coin cells or laboratory cells knows that newly assembled batteries must rest for a period of time to allow the electrolyte to fully soak into the electrodes. In industrial production, this step is performed ashigh-temperature aging.

The cells are placed in a controlled high-temperature aging room for a specified period to accelerate electrolyte diffusion into the electrode pores. Proper wetting is essential for stable SEI formation during the subsequent formation process.

During aging, the cell is not yet permanently sealed. Therefore, a temporary sealing pin must be used to close the filling port. Without temporary sealing, high temperature may cause electrolyte evaporation, leading to concentration change, performance instability, and potential safety hazards.


Table 1 — Purpose of High-Temperature Aging

Parameter

Engineering Purpose

Effect on Battery

Elevated temperature

Increase electrolyte diffusion rate

Improves wetting uniformity

Rest time control

Ensure full penetration of electrodes

Reduces formation defects

Temporary sealing

Prevent electrolyte evaporation

Maintains electrolyte composition

Controlled environment

Avoid contamination

Improves consistency


battery formation system


3. Formation Process and SEI Film Generation


After aging, the cells enter theformation process, which is the first electrochemical activation of the battery. The main objective of formation is to create a stablesolid electrolyte interphase (SEI)on the surface of the negative electrode.

During the first charge, the electrolyte decomposes at the graphite surface, forming a thin but dense SEI layer. This layer allows lithium ions to pass while preventing further electrolyte decomposition. The quality of the SEI film directly determines cycle life, internal resistance, and safety.

To obtain a high-quality SEI film, formation is usually performed using a multi-step current profile.

Step

Current Level

Purpose

Initial charge

Low current

Form dense SEI layer

Intermediate charge

Moderate current

Stabilize interface

Final charge

Higher current

Adapt to real working condition

Rest / discharge

Controlled

Check stability


Gas generation occurs during formation because electrolyte decomposition produces gases such as CO₂and hydrocarbons. To avoid gas accumulation at the electrode interface, industrial production often usesnegative-pressure formation, where gas is removed during the process.

Gas trapped between electrode layers can block lithium-ion transport paths, leading to non-uniform SEI formation and performance variation between cells.

In modern factories, formation systems are designed together with the
battery formation and grading equipment, ensuring precise current control, temperature stability, and gas management.


4. Secondary Electrolyte Filling


After formation, the cell undergoessecond electrolyte filling.

Two main reasons require this step:

- SEI formation consumes part of the electrolyte
- Negative-pressure formation removes some electrolyte together with gas

As a result, the electrolyte amount inside the cell becomes lower than the designed value. Secondary filling compensates for the loss and ensures correct electrolyte volume.

The operation is similar to the first filling, but the filling quantity is smaller. After the second filling, the filling port is welded to permanently seal the cell.


Table 2 — Comparison of First and Second Filling

Item

First Filling

Second Filling

Purpose

Initial wetting

Electrolyte compensation

Electrolyte volume

Full amount

Partial amount

Timing

After assembly

After formation

Sealing status

Temporary

Permanent after filling


5. OCV Measurement and High-Temperature K-Value Test


After sealing, the cell must undergotwo open-circuit voltage (OCV) measurementsbefore capacity grading.

The purpose is to calculate thehigh-temperature K-value, which describes the self-discharge rate of the battery.

The formula is:

K = (OCV1−OCV2) / (T2−T1)

Unit: mV/h

The cell is stored at elevated temperature between the two measurements. A large K-value indicates abnormal voltage drop, which may be caused by internal leakage, contamination, or micro-short circuits.

Cells with excessive K-value must be removed before grading.

Table 3 — Interpretation of High-Temperature K-Value

K-Value Level

Possible Cause

Action

Low

Normal self-discharge

Accept

Medium

Minor impurity

Monitor

High

Micro short circuit

Reject

Very high

Internal defect

Scrap


6. Capacity Grading (Formation Test Cycling)


Capacity grading is the process of charging and discharging the cell to measure capacity, internal resistance, and efficiency.

In industrial production, grading is usually performed at relatively high current (0.5C–1C) to simulate actual operating conditions.

Cells are then sorted into different grades according to measured capacity.

Example classification:

Grade

Capacity Range

Application

A

Highest capacity

High-performance pack

B

Standard

Normal products

C

Lower capacity

Secondary use

Reject

Out of spec

Scrap

Grading machines must provide accurate current control, temperature management, and high channel consistency, which is why they are normally integrated into a
battery pilot line or production line solution rather than used as standalone equipment.


7. Room-Temperature K-Value Test After Depolarization


After grading, the cells cannot be tested immediately again. The battery must rest at room temperature to allowdepolarization.

Right after charge and discharge, the voltage drops quickly due to relaxation of the electrode potential. If OCV is measured immediately, the calculated K-value will be artificially high.

Therefore, cells are stored for a period until voltage becomes stable, then a second K-value test is performed at room temperature.

This test further removes defective cells before shipment.


8. Final Release of Qualified Cells


After completing:

- First filling

- Aging

- Formation

- Second filling

- High-temperature K test

- Capacity grading

- Room-temperature K test

the cells can be released from the factory.

Although these steps occur at the end of the process, they determine whether the battery will meet its design specifications. Incomplete formation, poor wetting, insufficient electrolyte, or inaccurate grading will directly reduce cycle life and consistency.

For this reason, the formation and grading section is often the most power-consuming, time-consuming, and equipment-intensive part of a battery factory, and must be considered at the early stage of plant design.


About TOB NEW ENERGY


TOB NEW ENERGY is a global one-stop solution provider for battery manufacturing, covering laboratory research lines, pilot lines, and full-scale production lines. The company provides factory planning, equipment manufacturing, process integration, installation, commissioning, and technical training for lithium-ion, sodium-ion, solid-state, and next-generation battery technologies.

Learn more about complete solutions: TOB NEW ENERGY Battery Production Solutions

Tags